CMS has published the preliminary October 2026 Medicare Part B payment limit file. The big question each quarter is simple: what changed?
For Q4 2026, the answer is that most codes changed very little, but a smaller group moved significantly. Those larger changes are the ones worth reviewing before October 1.
This analysis compares the preliminary October 2026 file with the final July 2026 file. Because the October file is preliminary, CMS can still make changes before the final version is released. Historically, some of the largest outliers in the preliminary file are revised. The overall direction of the changes is more useful than the exact numbers at this stage.
The Big Picture
The July file included 890 codes, with 889 having a payment limit. The October file includes 918 codes, with 917 priced.
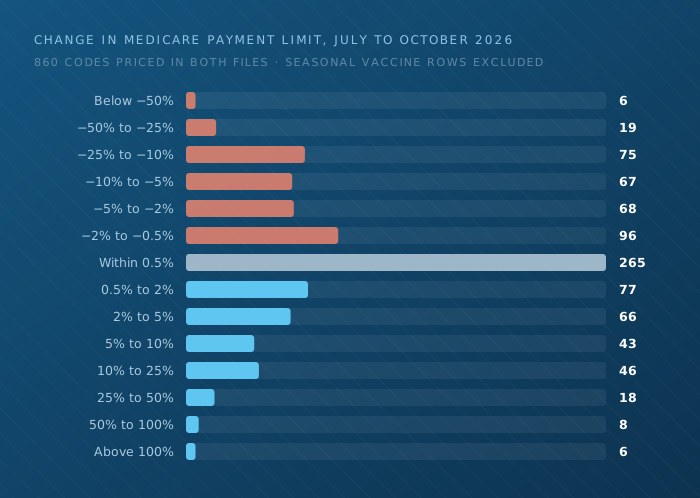
After excluding seasonal influenza and COVID-19 vaccine codes, which are covered by a separate pricing file, 860 codes can be directly compared between the two files.
| Measure | Q4 2026 |
|---|---|
| Codes priced in both quarters | 860 |
| Payment limits increased | 351 |
| Payment limits decreased | 433 |
| Unchanged to the cent | 76 |
| Median change per code | 0.0% |
| Codes that moved 10% or more | 178 |
Slightly more codes decreased than increased, which is the normal pattern in a quarter without a broad pricing event.
In other words, there was no broad increase or decrease across the entire file. Most of the movement is concentrated in a smaller number of codes.
Check your own codes: Every code in this article has a page on BuyandBill.com showing its current and pending payment limit. Start from the HCPCS Code Lookup if you have the J- or Q-code, the NDC Lookup if you are working from a package NDC, or the Drug Price Lookup to see how a limit has moved. The Medicare payment limit is free. ASP, WAC, and AWP require a login.
How Much Did Payment Limits Change?
Nearly one-third of the codes changed by less than 0.5%.
At the same time, there were 178 codes that moved by at least 10% in either direction.
Why Do Some Codes Move So Much?
One important factor is the number of manufacturers reporting ASP for a code.
A single-source brand generally reflects pricing from one manufacturer. A multi-source generic, on the other hand, uses a volume-weighted average across multiple manufacturers. A change in one manufacturer’s reported ASP, a revised submission, or a lapse in reporting can therefore have a larger effect on the overall payment limit.
| Sourcing | Codes | Up | Down | Median change | Moved 10%+ |
|---|---|---|---|---|---|
| Single source (1 labeler) | 518 | 221 | 243 | 0.0% | 44 |
| Two labelers | 78 | 30 | 41 | −0.5% | 17 |
| Multi-source (3 or more) | 264 | 100 | 149 | −1.4% | 117 |
Multi-source codes accounted for 117 of the 178 codes that moved by at least 10%. Their median change was also negative, which is consistent with the downward pricing pressure that can occur when multiple manufacturers compete for the same product.
The same pattern appears by code family. Biosimilars are one of the smallest groups in the file but the most likely to move 10% or more.
| Code family | Codes | Up | Down | Median change | Moved 10%+ |
|---|---|---|---|---|---|
| Oncology (J8xxx / J9xxx) | 175 | 71 | 91 | 0.0% | 32 |
| Biosimilars (Q5xxx) | 46 | 18 | 28 | −0.9% | 14 |
| J7xxx (immunosuppressants, inhalation, hyaluronans) | 105 | 49 | 45 | 0.0% | 19 |
| Other J-codes | 476 | 194 | 247 | −0.1% | 105 |
| Other Q-codes | 28 | 13 | 13 | 0.0% | 6 |
| Vaccines (90xxx / 91xxx) | 17 | 3 | 5 | 0.0% | 0 |
| Other | 13 | 3 | 4 | 0.0% | 2 |
The Biggest Percentage Changes
Looking only at percentage change can be misleading.
Many of the largest percentage changes are on relatively low-cost injectable drugs, where the per-unit limit is measured in cents. A payment limit can increase by more than 100% while changing very little on an actual claim.
Largest Increases
| Drug | Unit | July | October | Change |
|---|---|---|---|---|
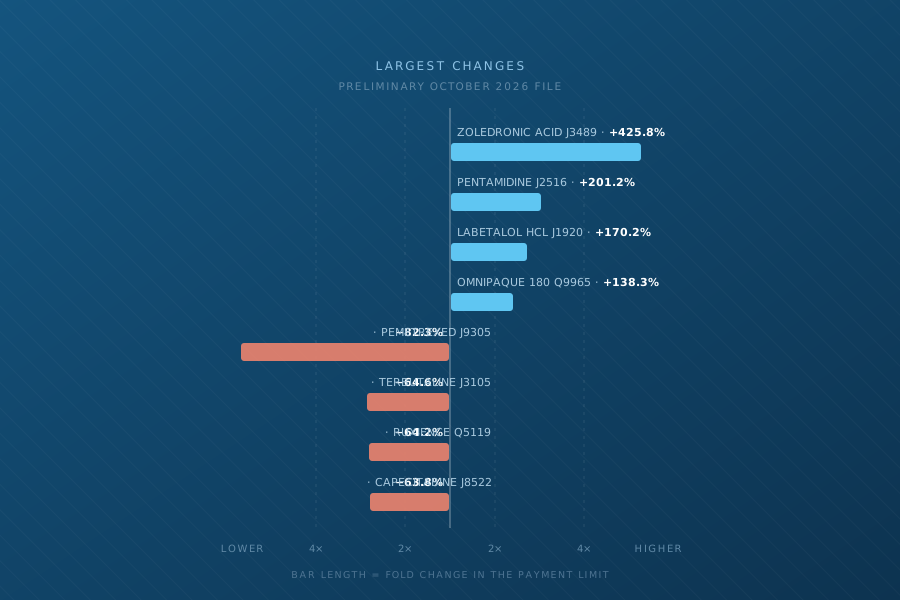
| Zoledronic acid J3489 | 1 MG · 12 labelers | $3.361 | $17.673 | +425.8% |
| Pentamidine isethionate J2516 | 1 MG · 2 labelers | $0.160 | $0.482 | +201.2% |
| Labetalol HCl J1920 | 5 MG · 10 labelers | $0.218 | $0.589 | +170.2% |
| Omnipaque 180 Q9965 | 1 ML | $0.750 | $1.787 | +138.3% |
| Ziextenzo Q5120 | 0.5 MG | $132.096 | $302.247 | +128.8% |
| Valproate sodium J3379 | 5 MG · 3 labelers | $0.014 | $0.032 | +128.6% |
| Ketorolac tromethamine J1885 | 15 MG · 16 labelers | $0.286 | $0.569 | +99.0% |
| Hydromorphone HCl J1171 | 0.1 MG · 4 labelers | $0.136 | $0.224 | +64.7% |
Largest Decreases
| Drug | Unit | July | October | Change |
|---|---|---|---|---|
| Pemetrexed J9305 | 10 MG · 13 labelers | $6.952 | $1.230 | −82.3% |
| Terbutaline sulfate J3105 | 1 MG · 4 labelers | $2.820 | $0.998 | −64.6% |
| Ruxience Q5119 | 10 MG | $16.160 | $5.792 | −64.2% |
| Capecitabine J8522 | 50 MG · 13 labelers | $0.080 | $0.029 | −63.8% |
| Daptomycin J0877 | 1 MG | $0.057 | $0.022 | −61.4% |
| Temozolomide J8700 | 5 MG · 4 labelers | $0.425 | $0.208 | −51.1% |
| Lucentis J2778 | 0.1 MG | $51.090 | $26.384 | −48.4% |
| Paclitaxel protein-bound J9264 | 1 MG · 11 labelers | $6.586 | $3.640 | −44.7% |
Two preliminary outliers worth watching:
Zoledronic acid (J3489) increases from $3.361 to $17.673 per mg, a 425.8% increase. The code has historically priced around $3 per mg.
Pemetrexed (J9305) decreases 82.3% to $1.230 per 10 mg.
Both changes should be treated cautiously until CMS releases the final file. They have the characteristics of changes that could be related to ASP reporting rather than a fundamental change in market pricing.
Biosimilars Are Driving Some of the Changes
One clear pattern is in the ophthalmology market.
Eylea, Eylea HD, Vabysmo, and Lucentis all decrease in the October file. Lucentis falls 48.4% to $26.384 per 0.1 mg.
At the same time, the newly added biosimilar Nufymco (Q5168) enters at $26.384 per 0.1 mg.
That is because a new biosimilar without its own sales history generally starts with a payment limit based on the reference product’s ASP.
This is important because a new biosimilar can affect the payment limits and economics of an entire drug class, not just its own code.
Read the class, not the code: Drug Comparative Graphing charts two products against each other, and Biosimilar Analysis groups every molecule with its reference product. For a full class in a single view, with the ASP range, the median, and each product’s price curve, the Comparative Report covers it once you are logged in.
Payment Limit Changes Do Not Always Mean Drug Prices Changed
A payment limit can move significantly even when the underlying market price of a drug has not changed by the same amount.
The clearest case is AMP-based pricing. When a drug’s ASP is more than 5% higher than the applicable average manufacturer price (AMP), CMS can use 103% of AMP instead.
Seven codes carry this methodology flag in the October file, and all seven decrease.
| Drug | Unit | July | October | Change |
|---|---|---|---|---|
| Ruxience Q5119 | 10 MG | $16.160 | $5.792 | −64.2% |
| Bendamustine HCl J9036 | 1 MG | $11.599 | $9.264 | −20.1% |
| Palonosetron J2469 | 25 MCG | $0.574 | $0.469 | −18.3% |
| Irinotecan HCl J9206 | 20 MG | $1.851 | $1.569 | −15.2% |
| Udenyca Q5111 | 0.5 MG | $149.133 | $128.967 | −13.5% |
| Syfovre J2781 | 1 MG | $148.944 | $135.267 | −9.2% |
| Daptomycin J0878 | 1 MG | $0.029 | $0.027 | −6.9% |
Ruxience is the most significant example. Its payment limit falls 64.2%, by far the largest decrease of the seven.
This does not mean Ruxience’s market price fell by 64%. It reflects the methodology, not the market.
New Codes, Retired Codes, and Descriptor Changes
The October file adds 38 codes and removes 10.
Of the new codes, 27 represent genuinely new products. Others are reissued codes or changes to existing products. Avopef (J9186) and Favlyxa (J9191) receive permanent HCPCS codes after previously being billed under a miscellaneous or NOC code.
| Drug | Billing unit | Labeler | October limit | Note |
|---|---|---|---|---|
| Itvisma J3405 | Per treatment | Novartis Gene Therapies | $2,729,937.92 | |
| Aucatzyl Q2058 | Per therapeutic dose | Autolus | $293,725.70 | Inflation-adjusted coinsurance |
| Papzimeos J3404 | Per therapeutic dose | Precigen | $116,684.87 | |
| Epioxa HD / Epioxa J2789 | Up to 2 ML | Glaukos | $41,359.62 | |
| Anascorp J0716 | Up to 120 MG | Rare Disease Therapeutics | $5,449.65 | |
| Anavip J0841 | 120 MG | Rare Disease Therapeutics | $1,084.91 | |
| Armlupeg Q5169 | 0.5 MG | Lupin Pharmaceuticals | $519.481 | Pegfilgrastim biosimilar |
| Exdensur J2361 | 1 MG | GlaxoSmithKline | $275.391 | |
| Ryzneuta J9361 | 0.5 MG | Acrotech Biopharma | $121.429 | |
| Yartemlea J1289 | 1 MG | Omeros | $105.441 | |
| Romidepsin J9318 | 0.1 MG | Amneal Pharmaceuticals | $32.864 | |
| Qivigy J1577 | 100 MG | Kedrion Biopharma | $29.280 | |
| Iopidine J2374 | 0.1 ML | Harrow Eye | $28.804 | |
| Aukelso Q5161 | 1 MG | Biocon Biologics | $27.509 | 8% of reference ASP added |
| Nufymco Q5168 | 0.1 MG | Zydus Pharmaceuticals | $26.384 | Ranibizumab biosimilar |
| Unloxcyt J9275 | 2 MG | Sun Pharmaceutical | $21.989 | |
| Favlyxa J9191 | 10 MG | Avyxa Pharma | $14.840 | |
| Enoby Q5167 | 1 MG | Hikma Pharmaceuticals | $7.681 | 8% of reference ASP added |
| Avopef J9186 | 1 MG | Avyxa Pharma | $4.240 | |
| Vykoura J0644 | 1 MG | Avyxa Pharma | $2.625 | |
| Cocaine HCl J0014 | 1 MG | LXO US | $1.825 | |
| Xifyrm J1737 | 1 MG | Azurity Pharmaceuticals | $1.060 | |
| Granisetron HCl Q0166 | 1 MG | Breckenridge Pharmaceutical | $0.774 | |
| Contepo J0528 | 20 MG | Meitheal Pharmaceuticals | $0.633 | |
| Daptomycin J0871 | 1 MG | Endo USA | $0.541 | |
| Baxdela J3268 | 1 MG | Melinta Therapeutics | $0.478 | |
| Hemady J8541 | 0.25 MG | Edenbridge Pharmaceuticals | $0.375 |
On the other side, the Fresenius Kabi fulvestrant code is retired, leaving the multi-source J9395 code at $5.021 per 25 mg.
Watch for Re-Based Dosage Descriptors
This is one of the areas most likely to cause a billing mistake.
Ten drugs were reissued under new codes with different, generally smaller, dosage descriptors. In these cases, the payment limit can appear to change dramatically simply because the unit being priced changed.
The two dollar columns below are each priced in that code’s own descriptor, so they cannot be compared directly. The last column restates both on a per-mg basis, which is what actually changed.
| Code change | Drug | Descriptor | July (per old unit) | October (per new unit) | Change per mg |
|---|---|---|---|---|---|
| J0640 → J0643 | Leucovorin calcium | 50 MG → 1 MG | $2.932 | $0.054 | −7.9% |
| J1953 → J1957 | Levetiracetam | 10 MG → 5 MG | $0.032 | $0.013 | −18.8% |
| J1953 → J1958 | Levetiracetam in NaCl | 10 MG → 5 MG | $0.032 | $0.033 | +106.2% |
| J7514 → J7530 | Myhibbin | 100 MG → 5 MG | $2.296 | $0.115 | +0.2% |
| J7517 → J7524 | Mycophenolate mofetil | 250 MG → 5 MG | $0.131 | $0.002 | −23.7% |
| J7519 → J7526 | Mycophenolate mofetil IV | 10 MG → 5 MG | $0.399 | $0.200 | +0.3% |
| J7528 → J7529 | Mycophenolate oral susp. | 100 MG → 5 MG | $0.164 | $0.034 | +314.6% |
| J9181 → J9187 | Etoposide | 10 MG → 1 MG | $1.018 | $0.094 | −7.7% |
| J9190 → J9192 | Fluorouracil | 500 MG → 10 MG | $2.024 | $0.039 | −3.7% |
| J9352 → J9362 | Yondelis | 0.1 MG → 0.01 MG | $410.479 | $41.844 | +1.9% |
Two examples stand out:
- Mycophenolate mofetil oral suspension (J7528 → J7529) shows a 314.6% increase.
- The levetiracetam split results in J1957 decreasing 18.8% while J1958 increases 106.2%.
Most of the other changes in this group are relatively small once the dosage descriptors are normalized.
Important: Before submitting October claims, make sure your billing system is using the correct HCPCS code and dosage descriptor.
Seasonal Vaccines Are Excluded
The October quarterly file includes 20 seasonal influenza and COVID-19 vaccine rows.
These codes are excluded from the analysis because, beginning August 1, 2026, they are governed by the separate 2026/2027 Seasonal Vaccine Price File.
For example, the October quarterly file shows:
- Fluzone High-Dose (90662): $98.160 → $122.522
- Comirnaty (91320): $168.367 → $230.405
These figures are not included in the statistics above.
What Should You Check Before the Final File?
If you are reviewing the October payment limits for reimbursement or budgeting purposes, focus on these areas first:
-
Your highest-volume codes. A 3% change on a high-volume biologic can matter much more than a 400% change on a generic you bill only a few times a month. Run them through the Drug Price Lookup before you rank anything by percentage.
-
Codes with methodology flags. AMP-based pricing and other methodology changes can cause significant movement that does not necessarily reflect a comparable change in acquisition cost.
-
Re-based dosage descriptors. Confirm that your billing system is using the correct code and unit before your first October claim. The NDC Lookup maps a package NDC to its current code, and the Billing Calculator works from the current descriptor and billing unit.
-
Extreme outliers. Zoledronic acid (J3489) and pemetrexed (J9305) are two preliminary changes worth checking again when CMS releases the final file.
-
New biosimilar entries. Watch the reference product and the rest of the class, not just the new code, as the entrant’s ASP develops. The Comparative Report shows the whole class in one view.
Track Every Payment Limit Change
BuyandBill.com publishes the full Medicare Part B payment limit file when CMS releases it, along with ASP, WAC, and AWP information for each HCPCS code.
The free tools on this site cover the day-to-day lookups:
- HCPCS Code Lookup — find a J-, Q-, or C-code and its current payment limit
- NDC Lookup — trace a package NDC to its HCPCS code and billing units
- Drug Price Lookup — see how a drug’s payment limit has moved
- Billing Calculator — work out units and reimbursement from the current descriptor
- Drug Comparative Graphing — chart two drugs against each other
- Biosimilar Analysis — every biosimilar alongside its reference product
- Medically Unlikely Edits and HCPCS Modifiers — the limits and modifiers that go on the claim
Log in to the pricing platform for ASP, WAC, and AWP, the full pricing history behind every code, and the Comparative Report, which puts every product in a drug class side by side with its ASP range, median, and price curve. Biosimilars and 505(b)(2) products can be compared against their reference products in the same view.
If you do not have an account yet, you can register here.
[Source: CMS ASP Pricing Files, July 2026 Medicare Part B Payment Limit Files (final), and October 2026 Medicare Part B Payment Limit Files (preliminary). Drug names and labeler counts are from the corresponding NDC-to-HCPCS crosswalks.]
Frequently Asked Questions
When do the October 2026 payment limits take effect?
October 1, 2026. CMS publishes a preliminary file in advance and a final file closer to the effective date. The figures in this article come from the preliminary file and may be revised before October 1.
Every code's current and pending limit is on its page at BuyandBill.com — start from the HCPCS Code Lookup.
Is the Medicare payment limit the same as ASP?
No. The payment limit is generally 106 percent of the volume-weighted ASP, but there are three standing exceptions:
* CMS substitutes an AMP-based limit (103 percent of AMP) when ASP exceeds AMP by more than five percent. * Some reference biologics facing competition are paid on a lesser-of basis. * Qualifying biosimilars receive 8 percent of the reference product's ASP as an add-on.
ASP and the payment limit are published separately for every code. See Medicare Part B Reimbursement for how the two relate.
Why did a generic drug's payment limit change by more than 100 percent?
Multi-source codes are volume-weighted averages across every labeler that reports ASP. If a labeler restates a submission, misses a reporting period, or exits the market, the blended average can move sharply even though no single company changed its price much.
These are also the codes CMS most often revises between the preliminary and the final file, so a triple-digit swing on a multi-source generic is worth re-checking rather than acting on immediately.
What does the inflation-adjusted coinsurance flag mean?
It marks drugs whose prices rose faster than the CPI-U benchmark, which triggers a manufacturer rebate and reduces the beneficiary's coinsurance to a percentage of the inflation-adjusted amount.
It changes what the patient owes, not the payment limit itself. The flag sits on 81 codes in October, down from 105 in July.
A code I bill was replaced with a new one. Is the price really different?
Usually not. Ten drugs in the October file were re-issued under new codes with smaller dosage descriptors, so the per-unit figure changed because the unit changed, not the price.
Normalize both codes to a common unit before concluding the price moved, and confirm the descriptor before submitting claims dated on or after October 1. The Billing Calculator works from the current descriptor and billing unit.