Priced per 10 mg · vs Rituxan Open full analysis →
-
Coding References
Learn
Solutions
- Subscription Options

Biosimilar Analysis · Medicare Part B
Pick a molecule to compare CMS payment limits against the reference product, with a link to each drug page. Q4 2026 data, refreshed October 6.
Figures are free CMS payment limits. True ASP, WAC & AWP come with a 7-day free trial →
No published payment limit 3
Coded biosimilars CMS has not yet priced for Q4 2026. See all 22 →
Q5157 · Celltrion USA · entered 2025
Q5158 · Fresenius Kabi · entered 2025
No published payment limit 5
Coded biosimilars CMS has not yet priced for Q4 2026. See all 22 →
No published payment limit 1
Coded biosimilars CMS has not yet priced for Q4 2026. See all 22 →
No published payment limit 1
Coded biosimilars CMS has not yet priced for Q4 2026. See all 22 →
No published payment limit 5
Coded biosimilars CMS has not yet priced for Q4 2026. See all 22 →
No published payment limit 6
Coded biosimilars CMS has not yet priced for Q4 2026. See all 22 →
No published payment limit 1
Coded biosimilars CMS has not yet priced for Q4 2026. See all 22 →
Trusted by Leading Healthcare Organizations





















































































Head to Head
Put the reference against a biosimilar — or two biosimilars against each other — and compare price, direction, and market tenure at a glance.
Beyond the CMS file
These products already carry a HCPCS code, but CMS has published no Q4 2026 payment limit against it. They span 7 molecules, the oldest coded back in 2024, and they are in the market all the same.
Adalimumab 6
Aflibercept 5 Eylea pays $722.251 per 1 mg
Denosumab 5 Xgeva pays $29.856 per 1 mg
Ustekinumab 3 Stelara pays $10.249 per 1 mg
Filgrastim 1 Neupogen pays $0.994 per 1 mcg
Infliximab 1 Remicade pays $29.856 per 10 mg
Omalizumab 1 Xolair pays $45.687 per 5 mg
Who it's for
Four questions this page already answers with Q4 2026 CMS data. Each one opens the tool that answers it.
“Which product protects our margin on this claim?”
Compare biosimilars side by side to evaluate WAC, AWP, ASP, and Medicare payment limits, helping ensure accurate reimbursement and informed billing decisions.
On this page Widest gap: Medicare pays 92.0% less for Ruxience than Rituxan“Should our next purchase be the biosimilar?”
Assess biosimilar alternatives for office-administered drugs by comparing historical pricing and reimbursement data to support buy-and-bill decisions.
On this page 10 molecules have three or more priced biosimilars“What would switching save us next year?”
Analyze biosimilar pricing trends and reimbursement over time to support budgeting, forecasting, and cost-saving opportunities across the practice.
On this page 22 biosimilars have a code but no Medicare price yet“Is the price gap wide enough to act on?”
Evaluate biosimilar pricing, reimbursement, and historical market trends to support reimbursement reviews, market analysis, audits, and strategic recommendations.
On this page Medicare pays less than the reference for 39 of 55 biosimilarsFAQs
How biosimilar pricing analysis works on BuyandBill.com, and where the data comes from.
Still have a question? Contact usComparing a biosimilar with its reference product on price and reimbursement. For Medicare Part B drugs, that means putting ASP, WAC, AWP, and the Medicare Payment Limit side by side and watching how the gap between them moves over time.
Practices use it to decide which product to buy and bill. Administrators use the trends for budgeting and forecasting. Payers and consultants use them for formulary and policy reviews, and manufacturers watch competitor prices.
Without an account you get the HCPCS code, billing units, NDC packages, and the Medicare Payment Limit, which is the figure every comparison on this page is built from. ASP, WAC, and AWP need a login, as does pricing history back to January 2015. The biosimilar list itself comes straight from CMS files and is free. For the rest of what governs the claim on any one of these codes, including the MUE cap and whether Part B covers it at all, see Medicare Part B reimbursement.
The explorer above shows a whole biosimilar family at once, free. Drug Comparative Graphing charts two drugs at a time, and your first five comparisons need no account. Charting up to 15 codes on one graph, the full comparative report, and history back to January 2015 all require a login.
The Medicare Payment Limit shown here updates each quarter, in January, April, July, and October, and the biosimilar list refreshes whenever CMS updates it. Behind a login, ASP follows the same quarterly schedule while WAC and AWP are refreshed every week, straight from drug manufacturers.
What BuyandBill.com Does
Search any National Drug Code for its package description, pricing, and aligned HCPCS code.
Explore More →Search any HCPCS code for its descriptor, aligned NDC packages, pricing, and reimbursement.
Explore More →Track ASP, WAC, and AWP across 10+ years of history in tabular and graphical formats.
Explore More →Compare ASP, WAC, and AWP across drugs and biosimilars in interactive charts.
Explore More →Track pricing, coding events, and reimbursement trends for physician-administered drugs to guide market decisions.
Explore More →Convert package pricing to billing units and estimate reimbursement in seconds.
Explore More →Compare biosimilars instantly with complete visibility into WAC, AWP, ASP, and Medicare payment limits — all in one place.

The Comparative Report puts ASP, the Medicare payment limit, WAC and AWP for up to 15 drugs on one timeline. Ten-plus years of monthly history, per HCPCS unit.
Included with BuyandBill Pro for $37/month billed annually.
Trastuzumab class, seven products
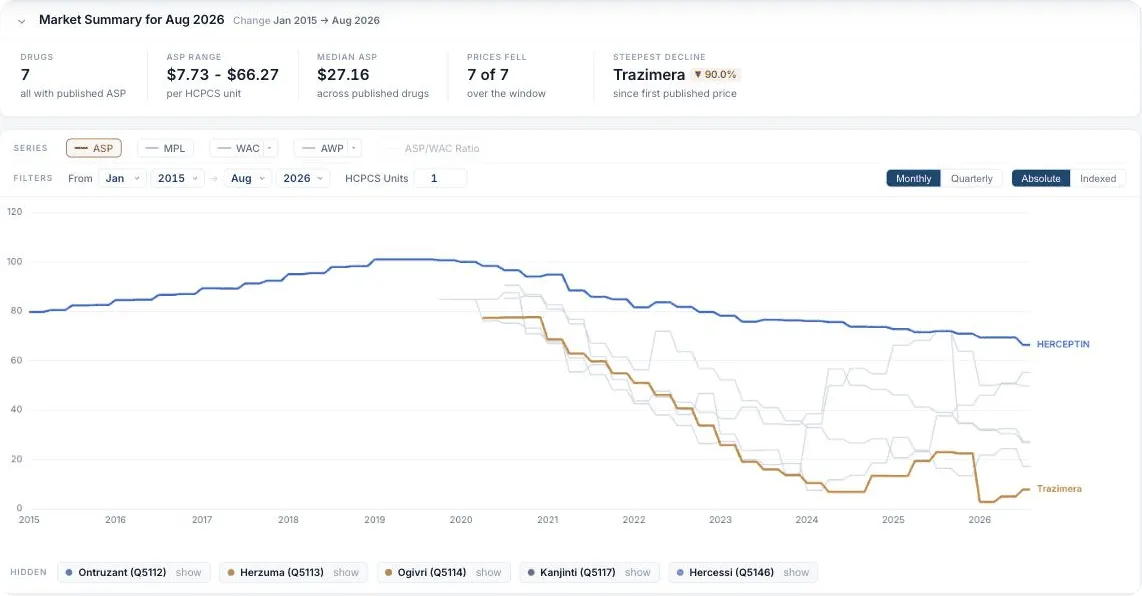
Actual published ASP, Jan 2015 to Aug 2026.