NDC Lookup
Search any National Drug Code for its package description, pricing, and aligned HCPCS code.
Explore More →
Chart a reference product against its biosimilar, or any two Medicare-priced drug codes, and see how their payment limits moved quarter by quarter. Two years are free; ASP, WAC, AWP, the full history, and 15 codes on one chart come with a subscription.
Trusted by Leading Healthcare Organizations





















































































Free tool · 5 free comparisons, no account needed
Put a reference product and its biosimilar on the same axis, or search any two Medicare-priced drug codes. Medicare Payment Limit, nine quarters, straight from the CMS quarterly payment limit file.
Medicare Payment Limit per 10 mg
Avastin · reference
$75.492
+3.8% over nine quarters
Mvasi · biosimilar
$28.294
+6.4% over nine quarters
Gap this quarter
−62.5% $47.198 per 10 mg
Mvasi below Avastin
Payment limit, indexed 100 at the first quarter
Q4 2024 to Q4 2026 Both drugs on one dollar axis Medicare Payment Limit only
You are seeing one benchmark and nine quarters.
A subscription puts ASP, WAC, and AWP on the same axis, opens the earlier quarters, plots every Bevacizumab biosimilar at once, and exports the comparative report as a PDF.
You’ve used your 5 free comparisons
Log in to keep charting, or start a 7-day free trial to put ASP, WAC, and AWP on the same axis and compare up to 15 codes at once.
How It Works
Two drugs, one chart, nine quarters of the Medicare Payment Limit. Five comparisons free, no account needed. A subscription removes the cap, widens the window, and adds the other three benchmarks.
Search either box for any drug or HCPCS code. Both are yours to change, and a biosimilar family loads a pair in one click.
Dollars compares price. Indexed compares movement. Gap shows the difference in percent. Hover a quarter to read both figures.
Add true ASP, WAC, and AWP, 15 codes on one chart, history back to January 2015, and a PDF you can send on.
Reference vs Biosimilar
The 14 molecules with a reference product and at least one biosimilar CMS prices today, at the Medicare Payment Limit for Q4 2026, ordered by the widest gap against their reference drug. Filter for your molecule, or open the full set. Pick any row to chart the pair above, or follow a drug through to its full record.
14 molecules · 51 pairs
No molecule matches that. Try a brand name like Avastin, a molecule like bevacizumab, or a code like Q5107.
14 of the 51 pairs sit above their reference product this quarter, led by Byooviz (Q5124) at +845.6% against Lucentis. These are the figures CMS published, not errors: a biosimilar sets its own Average Sales Price, and a newly launched one can sit above the originator for several quarters before it settles below.
Pairs are only listed when both codes bill in the same unit, so every difference on this page is a real price gap rather than a unit mismatch. Figures are the Medicare Payment Limit per billing unit; a subscription opens the ASP, WAC, and AWP behind each.
What You Get
This chart shows one benchmark, two drugs, nine quarters. Here is the rest of it.
The three benchmarks behind the payment limit, plus the ASP/WAC ratio, on every drug we cover.
Graph up to 15 HCPCS codes at once, back to January 2015.
Keep a report to come back to, and filter down to a drug class.
Every price refreshes weekly, so the figures are the current ones.
Who It's For
Four questions, four answers from this quarter's figures. Each one loads into the chart at the top of the page.
Billing & revenue cycle
Avastin is +3.8% over nine quarters
Chart J9035Practices that buy and bill
Ruxience sits 92.0% below Rituxan
Chart J9312 vs Q5119Market access & pricing
Rituxan and Ruxience, rebased to 100 at the same quarter
Chart the trendPayers & consultants
Byooviz is +845.6% against Lucentis
Chart the gapFAQs
What can be charted for free, how the benchmarks differ, and how often the pricing behind them is refreshed.
Still have a question? Contact usThe chart on this page compares two drugs at a time. You can put a reference product against one of its biosimilars, or against any other drug code that Medicare prices. A subscription raises that to 15 codes on a single graph, and lets you save the report and return to it.
The free chart shows the Medicare Payment Limit, which is the amount Medicare Part B allows per billing unit. A subscription adds ASP, WAC, and AWP, so that list price and reimbursement appear on the same graph.
Only when both codes bill in the same unit. Every figure here is a price per billing unit, and each code sets its own: one drug can be priced per 10 mg and another per 1 mg, so putting those two dollar figures side by side would tell you nothing. When the units differ, the tool still charts both drugs, but it hides the gap, switches off the Gap view, and names the two units so you can see why.
ASP and the Medicare Payment Limit follow the CMS quarterly schedule, taking effect in January, April, July, and October, and we apply CMS corrections as soon as they are published. WAC and AWP are refreshed every week. This page is rebuilt daily, so the comparison always reflects the current published quarter. For a whole molecule at once rather than two codes, the biosimilar analysis workbench charts every biosimilar against its reference product.
The free chart cannot be downloaded, but none of its figures are hidden: hover over any quarter to read the payment limit for both drugs. Subscribers can download the full comparative report as a PDF.
Yes. Your first five comparisons are free and require no account: choose any two drugs and chart nine quarters of the Medicare Payment Limit for both. After the fifth, the chart asks you to log in or subscribe before drawing a new pair. ASP, WAC, and AWP, along with the history back to January 2015, are what a subscription adds.
What BuyandBill.com Does
Search any National Drug Code for its package description, pricing, and aligned HCPCS code.
Explore More →Search any HCPCS code for its descriptor, aligned NDC packages, pricing, and reimbursement.
Explore More →Track ASP, WAC, and AWP across 10+ years of history in tabular and graphical formats.
Explore More →Convert package pricing to billing units and estimate reimbursement in seconds.
Explore More →Start a free trial and chart ASP, WAC, and AWP across drugs and biosimilars on one interactive graph.

The Comparative Report puts ASP, the Medicare payment limit, WAC and AWP for up to 15 drugs on one timeline. Ten-plus years of monthly history, per HCPCS unit.
Included with BuyandBill Pro for $37/month billed annually.
Trastuzumab class, seven products
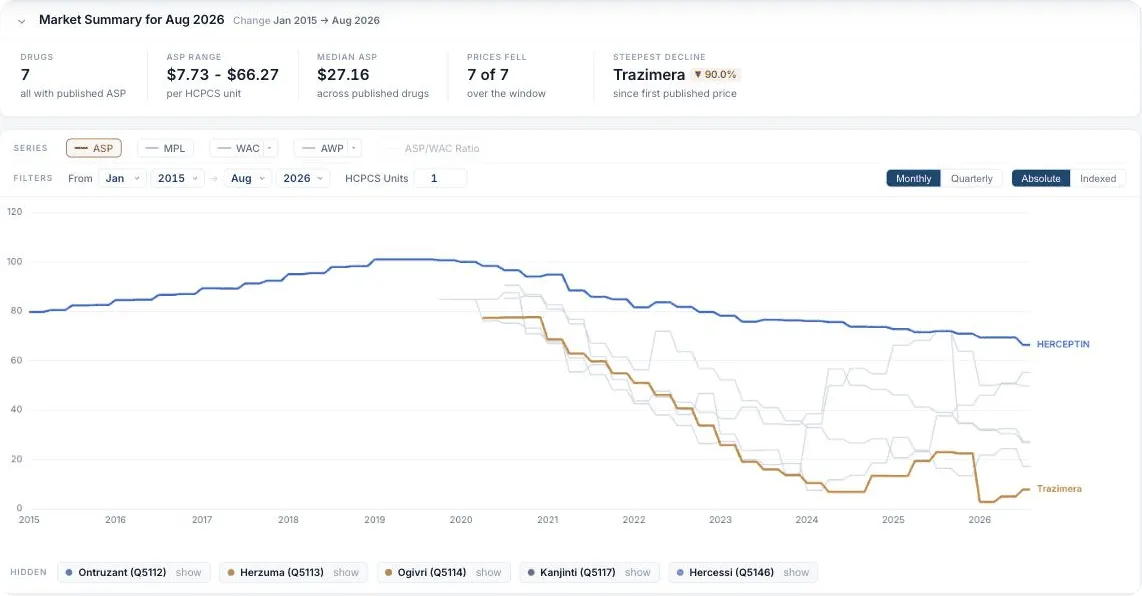
Actual published ASP, Jan 2015 to Aug 2026.